💡 Note: Some tutorials in this article are interactive. Click the blinking target to advance to the next step.
Contents
Navigation
Productivity Insights Panel
Start/End Dates
Actual Hours/Scheduled Labor Toggles
Job Plan Analysis
Published/Draft Job Plan
Hours/Average/Max Workers
Labor Loading Graph
Labor Consumption Graph
Zoom and Filter
Version History
Job Plan Drawer
Related Material
Schedule To Your Forecast
Forecast Builder
Labor Recommendation Modal
Labor Request Baseball Card
Role Ratios
Role Categories
Navigation
- Click the name of a job to access the Baseball Card.
- Click on the
 Icon to access the job's Pages
 - Navigate to the Labor Planning Homepage
Productivity Risks Modal
-
The Productivity Risks Modal will show on applicable jobs
- Click to expand the Productivity Risks drawer on the right
- More Information
Actual Hours/Scheduled Worker Toggles
- Toggle on/off the ability to see Actual Hours displayed on the Labor Loading graph and the Job Plan Drawer.
- Toggle on/off the ability to view Scheduled Labor on the job. Scheduled Labor will include RIVET Recommendations as well as Labor Requests.
Start/End Dates
Clicking this section will access the Job Setup section
Quickly adjust the Start/End dates of the job
Job Plan Analysis
- Expand the Job Plan Analysis by clicking the downward arrow to the left of the metrics.
- Clicking the numbers displayed will provide more details behind the numbers.
- If there is math involved behind a number being displayed, clicking the number will display the math used to arrive at the displayed metric.
Published/Draft Job Plan
- Once you edit your Job Plan, it will live in a draft state until you publish it.
- Publishing your Job Plan pushes the plan out to the Job Schedule and Roster Board views.
Hours/Average/Max Workers
- Use these selections to change how the data will be displayed on the Labor Loading Graph.
- Clicking again on a selection will provide more information on how the data is shown.
Progress To Completion Bars
- Clicking each bar will show the math behind the display.
- Each bar will have it's own unique equations that go into presenting the data.
Labor Loading Graph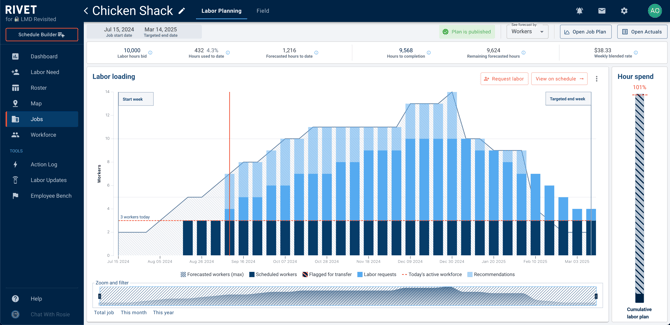
The labor loading graph gives you a graphical representation of this jobs forecast. The forecast, scheduled workers, workers that have been flagged for transfer, requested labor, RIVET Recommended labor, and today's active workers are all displayed.
Labor Consumption Graph
- View the Cumulative Forecasted Labor compared to the Actual Labor on a job.
- Scroll over the weeks to view the numbers displayed on the graph.
Zoom/Filter Tool
- Click on the left or right side of the Zoom and Filter tool
- Drag the sides of the tool towards the center to zoom in
- Drag the sides of the tool towards the outside to zoom out
- Utilize the quick filter buttons to zoom to this month, this year, or the total job.
↑ Back to top
Version History
Navigate to the Labor Planning Homepage
Click Version History in the upper right
View or revert back to past versions of this job's forecast
Job Plan Drawer
Forecast
- Open the Job Plan Drawer by clicking the 'Open Job Plan' button in the upper right corner
- The initial section you land on will be Forecast
- Navigate through the cells using the 'tab' key on your keyboard
- Use the 'Jump to date' feature to quickly access the data you need to see
The icons in the Job Plan Drawer are defined below:
![]()
Revert to last published (undo) - Clicking this button will remove any changes made since the forecast was last published.
![]()
Open Forecast Builder - Open the automated Forecast Builder tool.
![]()
Move Forecast - Pick up and move forecast to a later date if a job is delayed.
![]()
Mark last updated as today - Change the 'last edited' date to today.
Note: For 'Low confidence' Role Recommendations due to a stale forecast, clicking 'Mark last updated as today' will remove the 'low confidence' flag.
Publish Job
Publish Minor Version
Publishing a Minor Version of the forecast will automatically assign an incremental name to the new forecast. This is best used when the forecast is only changing by one or two workers.
💡 Note: The naming convention for minor changes to the forecast is by .1 each time. The original forecast is 1.0. Each minor change will be 1.1, 1.2, 1.3 in sequence.
Publish Major Version
Publishing a Major Version of the forecast is reserved for when the labor hours change by more than 5%. When a new Major Version of the forecast is published, the user will be prompted to create a name for the new forecast and be given the opportunity to enter any additional comments.
Labor Needed
- Open the Job Plan Drawer by clicking the 'Open Job Plan' button in the upper right corner
- Navigate to Labor Needed from the header menu within the Job Plan Drawer
- Review RIVET Role Recommendations and Labor Requests
- Fulfill Labor Requests and/or staff Role Recommendations with labor